Data Portfolio
Gavi Vaccine Distribution Analysis using IBM Watson Analytics
Descriptive Analysis
Data were obtained from online databases maintained by Gavi the Vaccine Alliance, the Organisation for Economic Co-operation and Development (OECD), the United Nations (UN), the World Health Organization (WHO), and the World Bank Group (WBG) to create models for Gavi distribution likelihood, mortality, and region.


Gavi disbursements have assisted in increased vaccinations, particularly in countries with low GNI and large populations. Improvements are evident through 2014 but effects, especially on adult mortality, will take decades before data can be analyzed to reflect the impact. Even so, the short-term impacts displayed in the presentations are significant and future effects are expected to be at minimum reflective of the same worth.
Return on investment is traditionally calculated as the benefit divided by the investment. In the case of Gavi it is difficult to tie a value to benefits. The fact that an individual is vaccinated does not necessarily affect whether that individual would have become sick or died without the vaccine. The impact is more easily measured by the decrease in adult mortality rates, which is information that will not only be unavailable for several years but is also affected by many other influencing factors. One study identified 15 population and environmental factors that influence the level and cause of mortality (Curtiss & Grahn, 1980). (Many more factors exist. Since Curtiss & Grahn’s research, advances in medicine and technology have identified other factors to the specificity of what factors are influential based on the severity of a disease a patient may have.)
Model Development using Watson Analytics Vaccination and Adult Mortality
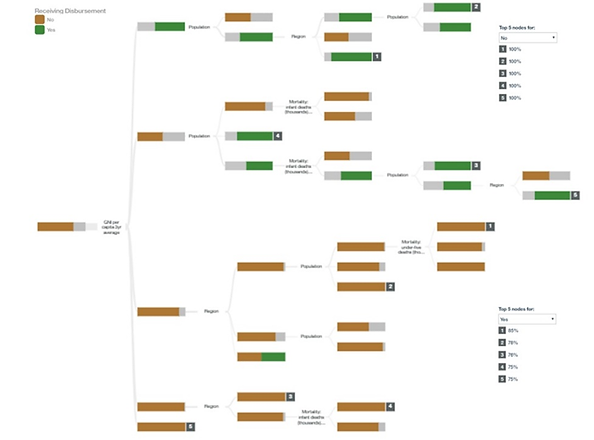
Model 1: Predicting Gavi distribution (Decision Tree with binary target)
The decision tree created using IBM Watson Analytics has a predictive strength of 84%. Five inputs were determined to be influencing factors: Gross National Income (GNI) per capita (3-year average), population, region, morality (infants), and mortality (under 5).
The decision model predicted a high number of “No” when predicting whether Gavi distributions were made. This is consistent with the data and the purpose of Gavi. The top five nodes based on GNI per capita 3-year average and population each had a predictive value of 100% when the outcome of the node was “No”. The top five nodes for “Yes” also began their split on the 3-year GNI average, but the order of the branch splits changed with Region being followed by population and infant mortality rate.
The predictive model for Receiving Gavi Distribution is accurate for 87% of its predictions that a distribution will not be made and 73% accurate in predicting a distribution will be made.
Model 2: Predicting Adult Mortality Rate (Decision Tree with continuous target)
Predictors in the Decision Tree for Adult Mortality are region, year, Gavi distribution, and undernourishment. The highest target values (most deaths per thousand) range from 306 to 442. Region is the largest predictor. After groups are split into regions Gavi distribution predicts adult mortality in the Americas, and the Eastern Mediterranean; infant deaths predict adult mortality in Europe, and year predicts adult mortality in Southeast Asia. Mortality rate in Africa is split by year and undernourishment.
The Decision Tree for Adult Mortality clearly shows that there have been changes over time in all countries but especially Africa which has been one of Gavi’s main distribution areas.
Region and year are the best predictors. Africa had the highest mortality rates. The Predictive Model for Adult Mortality was filtered to exclude all regions but Africa. Country was the only important predictor. Countries with the highest mortality rate were Central African Republic, Lesotho, and Zimbabwe (predicted adult mortality 525.77, StDev. 94.98). Algeria, Cabo Verde, Mauritius, and Seychelles had the lowest predicted mortality rate (149.46, StDev. 27.24).
